Key findings
- Each figure is average retail revenue per kilowatt-hour, not a household tariff quote. EIA divides the money utilities reported by the kilowatt-hours they sold.
- The U.S. residential average in August 2026 is 18.16 cents per kWh, compared with 17.57 cents in August 2025 (+0.59 cents). EIA marks 2026 as preliminary and 2025 as final. California is 29.75 cents and Texas is 15.91 cents, the same kind of average.
- Hawaii is the highest at 47.18 cents. Nevada is the lowest at 12.72 cents.
- An example bill of 1,000 kWh — not a claim about typical use — would be $181.60 at the U.S. average, $471.80 at the Hawaii average, and $127.20 at the Nevada average.
- The U.S. total is EIA’s published total. It is not the average of the 51 rows on this page, because EIA rounds the national figure on its own.
Every state, ranked
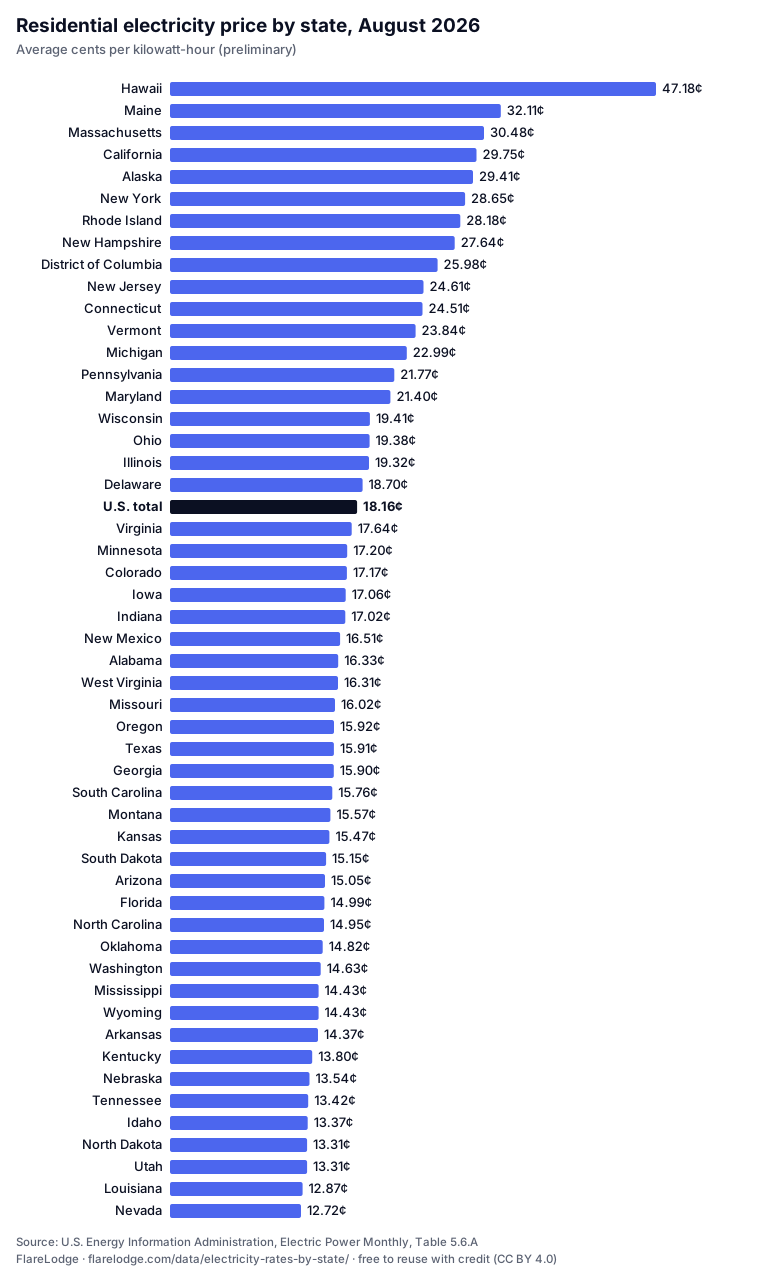
Residential price in every state
Cents per kilowatt-hour. Sorted from highest to lowest August 2026 price. Click a column heading to re-sort. A state name opens the electricity cost calculator with that price filled in. Download the CSV.
| 1 | Hawaii | 47.18¢ | 38.53¢ | +8.65¢ |
|---|---|---|---|---|
| 2 | Maine | 32.11¢ | 28.14¢ | +3.97¢ |
| 3 | Massachusetts | 30.48¢ | 30.55¢ | -0.07¢ |
| 4 | California | 29.75¢ | 30.92¢ | -1.17¢ |
| 5 | Alaska | 29.41¢ | 27.79¢ | +1.62¢ |
| 6 | New York | 28.65¢ | 26.64¢ | +2.01¢ |
| 7 | Rhode Island | 28.18¢ | 26.53¢ | +1.65¢ |
| 8 | New Hampshire | 27.64¢ | 24.44¢ | +3.20¢ |
| 9 | District of Columbia | 25.98¢ | 23.18¢ | +2.80¢ |
| 10 | New Jersey | 24.61¢ | 24.70¢ | -0.09¢ |
| 11 | Connecticut | 24.51¢ | 30.17¢ | -5.66¢ |
| 12 | Vermont | 23.84¢ | 22.10¢ | +1.74¢ |
| 13 | Michigan | 22.99¢ | 20.73¢ | +2.26¢ |
| 14 | Pennsylvania | 21.77¢ | 19.93¢ | +1.84¢ |
| 15 | Maryland | 21.40¢ | 19.89¢ | +1.51¢ |
| 16 | Wisconsin | 19.41¢ | 18.44¢ | +0.97¢ |
| 17 | Ohio | 19.38¢ | 17.55¢ | +1.83¢ |
| 18 | Illinois | 19.32¢ | 18.03¢ | +1.29¢ |
| 19 | Delaware | 18.70¢ | 16.85¢ | +1.85¢ |
| 20 | Virginia | 17.64¢ | 15.85¢ | +1.79¢ |
| 21 | Minnesota | 17.20¢ | 16.89¢ | +0.31¢ |
| 22 | Colorado | 17.17¢ | 16.21¢ | +0.96¢ |
| 23 | Iowa | 17.06¢ | 15.48¢ | +1.58¢ |
| 24 | Indiana | 17.02¢ | 16.21¢ | +0.81¢ |
| 25 | New Mexico | 16.51¢ | 15.98¢ | +0.53¢ |
| 26 | Alabama | 16.33¢ | 16.26¢ | +0.07¢ |
| 27 | West Virginia | 16.31¢ | 15.62¢ | +0.69¢ |
| 28 | Missouri | 16.02¢ | 15.32¢ | +0.70¢ |
| 29 | Oregon | 15.92¢ | 15.85¢ | +0.07¢ |
| 30 | Texas | 15.91¢ | 15.40¢ | +0.51¢ |
| 31 | Georgia | 15.90¢ | 15.55¢ | +0.35¢ |
| 32 | South Carolina | 15.76¢ | 15.16¢ | +0.60¢ |
| 33 | Montana | 15.57¢ | 14.29¢ | +1.28¢ |
| 34 | Kansas | 15.47¢ | 14.65¢ | +0.82¢ |
| 35 | South Dakota | 15.15¢ | 13.90¢ | +1.25¢ |
| 36 | Arizona | 15.05¢ | 15.09¢ | -0.04¢ |
| 37 | Florida | 14.99¢ | 15.33¢ | -0.34¢ |
| 38 | North Carolina | 14.95¢ | 14.59¢ | +0.36¢ |
| 39 | Oklahoma | 14.82¢ | 14.42¢ | +0.40¢ |
| 40 | Washington | 14.63¢ | 13.65¢ | +0.98¢ |
| 41 | Mississippi | 14.43¢ | 13.61¢ | +0.82¢ |
| 42 | Wyoming | 14.43¢ | 14.33¢ | +0.10¢ |
| 43 | Arkansas | 14.37¢ | 13.33¢ | +1.04¢ |
| 44 | Kentucky | 13.80¢ | 13.10¢ | +0.70¢ |
| 45 | Nebraska | 13.54¢ | 12.80¢ | +0.74¢ |
| 46 | Tennessee | 13.42¢ | 13.09¢ | +0.33¢ |
| 47 | Idaho | 13.37¢ | 12.08¢ | +1.29¢ |
| 48 | North Dakota | 13.31¢ | 12.97¢ | +0.34¢ |
| 49 | Utah | 13.31¢ | 13.62¢ | -0.31¢ |
| 50 | Louisiana | 12.87¢ | 12.55¢ | +0.32¢ |
| 51 | Nevada | 12.72¢ | 12.54¢ | +0.18¢ |
| United States | 18.16¢ | 17.57¢ | +0.59¢ |
How a bill is estimated
Cost in dollars = kilowatt-hours × cents per kWh ÷ 100. The same formula runs the electricity cost calculator.
- Example, U.S. average. 1,000 × 18.16 ÷ 100 = $181.60. The 1,000 kWh is an example we chose so the arithmetic is easy to check. It is not EIA’s figure for a typical home.
- Example, an appliance. A 1,500 watt heater run 3 hours a day for 30 days uses 1,500 × 90 ÷ 1,000 = 135 kWh. At Hawaii’s 47.18¢, that is $63.69.
Because the price is average retail revenue per kilowatt-hour, not a household tariff quote, fixed monthly charges are already averaged into the cents. A household that uses very little electricity often pays more per kWh than this average. To use the price printed on your own bill, choose “Custom price” in the calculator.
What this table leaves out
- In the table: residential prices only, for the 50 states and the District of Columbia, plus the U.S. total.
- Left on the EIA page: census-division rows (New England, Middle Atlantic, and the rest) and the commercial, industrial, transportation, and all-sectors columns. Those are real EIA figures; this page does not reprint them.
- Not a utility quote. Two neighbors in the same state can be on different rates. “NM” in the EIA table means not meaningful, and “--” means no data; neither appears in the residential column we republish.
Use this data
You are free to use these numbers, the table, and the CSV under CC BY 4.0. Credit FlareLodge with a link to this page, and name EIA as the source of the prices. Suggested citation:
FlareLodge, "Electricity Rates by State" (2026-11-06), https://flarelodge.com/data/electricity-rates-by-state/. Figures from U.S. Energy Information Administration, Electric Power Monthly Table 5.6.A, released 2026-10-23.
Archived with a DOI: doi.org/10.5281/zenodo.24057791 (CSV on Zenodo; all versions). Suggested citation for papers and reports:
FlareLodge (2026). Average residential electricity price by U.S. state, August 2026 and August 2025 (EIA Electric Power Monthly Table 5.6.A) [Data set]. Zenodo. https://doi.org/10.5281/zenodo.24057791
Common questions
What is the average residential electricity rate in the United States?
EIA’s U.S. total for residential customers in August 2026 is 18.16 cents per kilowatt-hour, up from 17.57 cents in August 2025. EIA marks the 2026 figures as preliminary.
Which state has the highest residential electricity rate?
Hawaii is highest on this table at 47.18 cents per kWh in August 2026. Nevada is lowest at 12.72 cents. These are statewide averages, not a single utility’s tariff.
What are the most and least expensive states for electricity?
Highest five in August 2026: Hawaii 47.18¢, Maine 32.11¢, Massachusetts 30.48¢, California 29.75¢, Alaska 29.41¢. Lowest five: Nevada 12.72¢, Louisiana 12.87¢, Utah 13.31¢, North Dakota 13.31¢, Idaho 13.37¢. All figures are residential cents per kWh from EIA Table 5.6.A (preliminary).
Where did electricity prices rise the most in the past year?
From August 2025 to August 2026, the largest increase was in Hawaii (+8.65 cents per kWh, to 47.18) and the largest drop was in Connecticut (-5.66 cents, to 24.51). 44 of 51 rows on this table went up.
Are the 2026 electricity rates final?
No. EIA’s note on Table 5.6.A says values for 2026 are preliminary estimates based on a cutoff model sample, and values for 2025 are final. This page was built from the release dated 2026-10-23. The next release date EIA lists is 2026-11-24.
How do I turn these rates into a bill?
Multiply kilowatt-hours by the price, then divide by 100 if the price is in cents. 1,000 kWh at the U.S. average is $181.60. That 1,000 kWh is an example, not average household use. The electricity cost calculator does the same multiplication for any state or for a price you type in.
Why is my bill different from the state average?
It is average retail revenue per kilowatt-hour (what utilities took in, divided by kilowatt-hours sold), not a household tariff quote. A fixed customer charge is already spread into that average, so your own rate plan can differ. Commercial and industrial prices are on the EIA table and are not repeated here.
Sources
- U.S. Energy Information Administration, Electric Power Monthly, Table 5.6.A. Data for August 2026, release date 2026-10-23. “Values for 2025 are final. Values for 2026 are preliminary estimates based on a cutoff model sample.” Source line on the table: Form EIA-861M (formerly EIA-826).
Related: electricity cost calculator · natural gas prices by state · temperature converter · all data pages.