Key findings
- Each figure is revenue divided by gas delivered to homes, as EIA computes it. It is not a quote from any one utility.
- The U.S. residential price for 2025 is $15.34 per Mcf, about $1.48 per therm, compared with $14.50 per Mcf in 2024 (+5.8%). California is $2.15 per therm, Texas $1.91 and Illinois $1.07.
- Hawaii is the highest at $52.38 per Mcf ($5.71 per therm). Idaho is the lowest at $7.69 ($0.74 per therm). Among states with prices in both years, the biggest rise since 2024 is in Washington (+38.5%).
- Summer months look expensive per Mcf because fixed charges are spread over little gas: the U.S. figure for August 2026 is $27.05 per Mcf ($2.61 per therm).
- EIA shows no 2025 residential price for Connecticut, Maine, Maryland, North Carolina, Rhode Island, South Carolina. They are listed at the bottom with their 2024 price where EIA has one, and are not ranked.
Every state, ranked
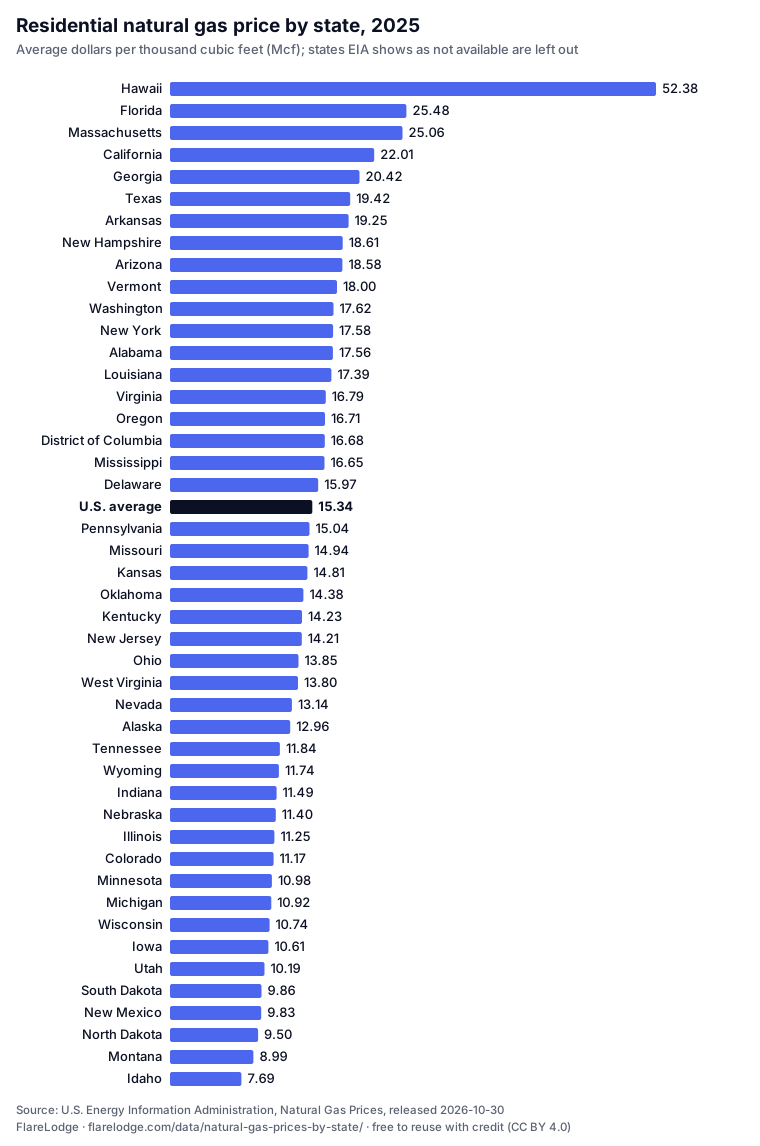
Residential price in every state
Price per therm comes first. Rows are sorted from highest to lowest 2025 price per Mcf, EIA’s own unit; click the $/therm heading to sort by price per therm. Per-therm prices use each state’s 2025 heat content. Click a column heading to re-sort. n/a means EIA shows the value as not available or withheld. Download the CSV.
| 1 | Hawaii | $5.71 | $52.38 | $48.88 | +7.2% | $72.36 |
|---|---|---|---|---|---|---|
| 2 | Florida | $2.49 | $25.48 | $25.37 | +0.4% | n/a |
| 3 | Massachusetts | $2.43 | $25.06 | $21.90 | +14.4% | $32.10 |
| 4 | California | $2.15 | $22.01 | $19.14 | +15.0% | $21.25 |
| 5 | Georgia | $1.98 | $20.42 | $18.19 | +12.3% | $43.91 |
| 6 | Texas | $1.91 | $19.42 | $17.98 | +8.0% | $36.84 |
| 7 | Arkansas | $1.88 | $19.25 | $16.09 | +19.6% | $33.08 |
| 8 | New Hampshire | $1.79 | $18.61 | $18.74 | -0.7% | n/a |
| 9 | Arizona | $1.81 | $18.58 | $20.47 | -9.2% | $27.30 |
| 10 | Vermont | $1.72 | $18.00 | $17.34 | +3.8% | $33.62 |
| 11 | Washington | $1.61 | $17.62 | $12.72 | +38.5% | $25.21 |
| 12 | New York | $1.70 | $17.58 | $16.58 | +6.0% | $28.04 |
| 13 | Alabama | $1.70 | $17.56 | $18.63 | -5.7% | $25.48 |
| 14 | Louisiana | $1.70 | $17.39 | $16.38 | +6.2% | n/a |
| 15 | Virginia | $1.60 | $16.79 | $15.40 | +9.0% | $31.14 |
| 16 | Oregon | $1.55 | $16.71 | $15.71 | +6.4% | $23.65 |
| 17 | District of Columbia | $1.61 | $16.68 | $16.49 | +1.2% | $33.05 |
| 18 | Mississippi | $1.63 | $16.65 | $15.42 | +8.0% | $35.28 |
| 19 | Delaware | $1.54 | $15.97 | $14.78 | +8.1% | $37.26 |
| 20 | Pennsylvania | $1.45 | $15.04 | $13.62 | +10.4% | $29.02 |
| 21 | Missouri | $1.46 | $14.94 | $16.86 | -11.4% | $32.93 |
| 22 | Kansas | $1.43 | $14.81 | $13.14 | +12.7% | n/a |
| 23 | Oklahoma | $1.39 | $14.38 | $13.99 | +2.8% | $44.97 |
| 24 | Kentucky | $1.36 | $14.23 | $13.61 | +4.6% | $37.05 |
| 25 | New Jersey | $1.37 | $14.21 | $13.21 | +7.6% | $20.13 |
| 26 | Ohio | $1.30 | $13.85 | $13.77 | +0.6% | n/a |
| 27 | West Virginia | $1.27 | $13.80 | $15.26 | -9.6% | n/a |
| 28 | Nevada | $1.26 | $13.14 | $18.69 | -29.7% | $16.53 |
| 29 | Alaska | $1.31 | $12.96 | $11.73 | +10.5% | $17.61 |
| 30 | Tennessee | $1.16 | $11.84 | $10.75 | +10.1% | $22.84 |
| 31 | Wyoming | $1.11 | $11.74 | $12.39 | -5.2% | n/a |
| 32 | Indiana | $1.09 | $11.49 | $9.50 | +20.9% | $24.02 |
| 33 | Nebraska | $1.08 | $11.40 | $10.63 | +7.2% | $26.52 |
| 34 | Illinois | $1.07 | $11.25 | $11.11 | +1.3% | $21.38 |
| 35 | Colorado | $1.05 | $11.17 | $10.58 | +5.6% | $17.94 |
| 36 | Minnesota | $1.04 | $10.98 | $10.65 | +3.1% | $18.06 |
| 37 | Michigan | $1.03 | $10.92 | $10.76 | +1.5% | $20.75 |
| 38 | Wisconsin | $1.02 | $10.74 | $10.14 | +5.9% | $18.56 |
| 39 | Iowa | $1.00 | $10.61 | $10.33 | +2.7% | $24.48 |
| 40 | Utah | $0.97 | $10.19 | $13.15 | -22.5% | $12.78 |
| 41 | South Dakota | $0.92 | $9.86 | $9.32 | +5.8% | $18.07 |
| 42 | New Mexico | $0.96 | $9.83 | $9.05 | +8.6% | n/a |
| 43 | North Dakota | $0.91 | $9.50 | $8.99 | +5.7% | $30.05 |
| 44 | Montana | $0.85 | $8.99 | $8.22 | +9.4% | $14.59 |
| 45 | Idaho | $0.74 | $7.69 | $8.51 | -9.6% | $14.96 |
| – | Connecticut | n/a | n/a | $16.83 | n/a | n/a |
| – | Maine | n/a | n/a | $18.95 | n/a | $40.33 |
| – | Maryland | n/a | n/a | $16.14 | n/a | $25.90 |
| – | North Carolina | n/a | n/a | $16.42 | n/a | n/a |
| – | Rhode Island | n/a | n/a | $21.66 | n/a | $23.75 |
| – | South Carolina | n/a | n/a | $16.91 | n/a | $30.80 |
| United States | $1.48 | $15.34 | $14.50 | +5.8% | $27.05 |
How a gas bill is estimated
Cost in dollars = therms used × price per therm. Your bill shows therms (some utilities show CCF; one CCF is 100 cubic feet, roughly one therm).
- Example, a winter month. 100 therms × $1.48 = $148.00 at the U.S. average. At the Hawaii average it is $571.00; at the Idaho average, $74.00. The 100 therms is an example we chose so the arithmetic is easy to check. It is not EIA’s figure for a typical home.
- The same energy as electricity. One therm holds the energy of about 29.31 kWh, so 100 therms is about 2,931 kWh. At the U.S. residential electricity price of 18.16¢ per kWh (August 2026, electricity rates by state), that is $532.27. This compares raw energy only. A furnace, a heat pump and a space heater turn that energy into heat with very different efficiency, so it is not a heating-cost comparison.
To price a space heater or any appliance on electricity, use the electricity cost calculator.
What this table leaves out
- In the table: residential prices only, for the 50 states and the District of Columbia, plus EIA’s U.S. figure, which is published by EIA and not averaged from the state rows.
- Per therm: EIA publishes dollars per Mcf. We divide by therms per Mcf from EIA’s 2025 heat content of gas delivered to consumers in each state (U.S. 1,036 Btu per cubic foot, so 10.36 therms per Mcf) and round to the cent.
- Preliminary months: EIA computes monthly residential prices first from Form EIA-857 and later replaces them with final figures from the annual Form EIA-176, so the August 2026 column can change.
- Left on the EIA page: commercial, industrial, electric power and city gate prices, and the share of residential deliveries included in the price.
Use this data
You are free to use these numbers, the table, and the CSV under CC BY 4.0. Credit FlareLodge with a link to this page, and name EIA as the source of the prices. Suggested citation:
FlareLodge, "Natural Gas Prices by State" (2026-11-08), https://flarelodge.com/data/natural-gas-prices-by-state/. Prices from U.S. Energy Information Administration, Natural Gas Prices (residential), release date 2026-10-30; heat content from EIA, Heat Content of Natural Gas Consumed.
Archived with a DOI: doi.org/10.5281/zenodo.24099274 (CSV on Zenodo; all versions). Suggested citation for papers and reports:
FlareLodge (2026). Residential natural gas price by U.S. state, 2025 and 2024 annual, with August 2026 (EIA Natural Gas Prices) [Data set]. Zenodo. https://doi.org/10.5281/zenodo.24099274
Common questions
What is the cost of natural gas per therm?
The U.S. residential average for 2025 is $1.48 per therm (EIA, $15.34 per Mcf at 1,036 Btu per cubic foot). By state it runs from $0.74 in Idaho to $5.71 in Hawaii; California is $2.15, Texas $1.91 and Illinois $1.07. These averages include fixed monthly charges spread over the gas sold, so the per-therm rates printed on a bill are usually lower, with the fixed charge listed on its own.
Which states have the cheapest natural gas per therm?
Ranked by 2025 price per therm, the five lowest are Idaho $0.74, Montana $0.85, North Dakota $0.91, South Dakota $0.92, New Mexico $0.96. The ranking by price per Mcf is almost the same; a few places swap because each state’s gas has a different heat content.
What is the average residential natural gas price in the United States?
EIA’s U.S. residential price for 2025 is $15.34 per thousand cubic feet (Mcf), up 5.8% from $14.50 in 2024. At EIA’s 2025 U.S. heat content of 1,036 Btu per cubic foot, that is about $1.48 per therm.
Which state has the highest natural gas prices?
Hawaii is highest on this table at $52.38 per Mcf in 2025 ($5.71 per therm). Idaho is lowest at $7.69 per Mcf ($0.74 per therm). EIA shows no 2025 residential figure for Connecticut, Maine, Maryland, North Carolina, Rhode Island, South Carolina, so they are not ranked.
How do I convert natural gas price per Mcf to price per therm?
One Mcf is 1,000 cubic feet. Multiply by the heat content in Btu per cubic foot, then divide by 100,000 Btu per therm. At 1,036 Btu per cubic foot, one Mcf is 10.36 therms, so $15.34 ÷ 10.36 = $1.48 per therm. This page uses each state’s own 2025 heat content.
Why is the summer price per Mcf so much higher?
The price is revenue divided by gas delivered. In summer, homes use little gas, but fixed monthly charges are still collected, so the average per Mcf rises. The U.S. figure for August 2026 is $27.05 per Mcf, against $15.34 for the whole of 2025. For a winter heating estimate, the annual price is the better guide.
How much is an average natural gas bill by state?
This page lists prices, not bills. A bill is therms used × price per therm, plus any charges your utility lists separately. For example, 100 therms in a winter month (an example, not average use) would cost $148.00 at the U.S. average, $571.00 at the Hawaii average and $74.00 at the Idaho average.
Which states have the most expensive natural gas per therm?
Ranked by 2025 price per therm, the five highest are Hawaii $5.71, Florida $2.49, Massachusetts $2.43, California $2.15, Georgia $1.98. The U.S. average is $1.48 per therm.
Where did natural gas prices rise or fall the most since 2024?
The U.S. residential price rose 5.8% from 2024 to 2025 (per Mcf). Among states with prices in both years, the biggest rises are Washington (+38.5%), Indiana (+20.9%), Arkansas (+19.6%). 9 states fell; the biggest drops are Nevada (-29.7%), Utah (-22.5%), Missouri (-11.4%). These are annual averages from EIA, not a single utility’s rate change.
Sources
- U.S. Energy Information Administration, Natural Gas Prices, residential price, annual (2025 and 2024). Release date 2026-10-30; next release date 2026-11-30.
- EIA, Natural Gas Prices, residential price, monthly (August 2026). Same release dates.
- EIA, Heat Content of Natural Gas Consumed, delivered to consumers (2025, Btu per cubic foot).
- EIA, Definitions, Sources and Notes for how residential prices are computed.
Related: electricity rates by state · electricity cost calculator · all data pages.